
37 lines
3.1 KiB
XML
37 lines
3.1 KiB
XML


<svg class="nj-fig nj-charts nj-charts--blog" viewBox="0 0 560 250" role="img" aria-labelledby="nj-blog-dist nj-blog-dist-d" xmlns="http://www.w3.org/2000/svg">
|
|
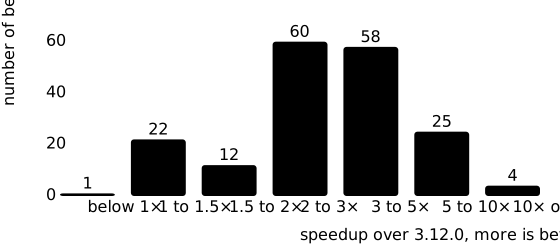
<title id="nj-blog-dist">Speedup of 3.13.0 over 3.12.0 for all 182 benchmarks of the suite</title>
|
|
<desc id="nj-blog-dist-d">Bars counting the benchmarks per speedup range: below 1x: 1; 1 to 1.5x: 22; 1.5 to 2x: 12; 2 to 3x: 60; 3 to 5x: 58; 5 to 10x: 25; 10x or more: 4. Median 2.9x, geometric mean 3.0x.</desc>
|
|
<line class="nj-charts-grid" x1="52" y1="196" x2="548" y2="196"/>
|
|
<text class="nj-charts-tick nj-charts-tick--r" x="46" y="200">0</text>
|
|
<line class="nj-charts-grid" x1="52" y1="144.571" x2="548" y2="144.571"/>
|
|
<text class="nj-charts-tick nj-charts-tick--r" x="46" y="148.571">20</text>
|
|
<line class="nj-charts-grid" x1="52" y1="93.1429" x2="548" y2="93.1429"/>
|
|
<text class="nj-charts-tick nj-charts-tick--r" x="46" y="97.1429">40</text>
|
|
<line class="nj-charts-grid" x1="52" y1="41.7143" x2="548" y2="41.7143"/>
|
|
<text class="nj-charts-tick nj-charts-tick--r" x="46" y="45.7143">60</text>
|
|
<rect class="nj-charts-c2" x="60.0" y="193.4" width="54.9" height="2.6" rx="3"><title>below 1×: 1</title></rect>
|
|
<text class="nj-charts-val" x="87.4" y="188.4" text-anchor="middle">1</text>
|
|
<text class="nj-charts-tick" x="87.4" y="212.0">below 1×</text>
|
|
<rect class="nj-charts-c1" x="130.9" y="139.4" width="54.9" height="56.6" rx="3"><title>1 to 1.5×: 22</title></rect>
|
|
<text class="nj-charts-val" x="158.3" y="134.4" text-anchor="middle">22</text>
|
|
<text class="nj-charts-tick" x="158.3" y="212.0">1 to 1.5×</text>
|
|
<rect class="nj-charts-c1" x="201.7" y="165.1" width="54.9" height="30.9" rx="3"><title>1.5 to 2×: 12</title></rect>
|
|
<text class="nj-charts-val" x="229.1" y="160.1" text-anchor="middle">12</text>
|
|
<text class="nj-charts-tick" x="229.1" y="212.0">1.5 to 2×</text>
|
|
<rect class="nj-charts-c1" x="272.6" y="41.7" width="54.9" height="154.3" rx="3"><title>2 to 3×: 60</title></rect>
|
|
<text class="nj-charts-val" x="300.0" y="36.7" text-anchor="middle">60</text>
|
|
<text class="nj-charts-tick" x="300.0" y="212.0">2 to 3×</text>
|
|
<rect class="nj-charts-c1" x="343.4" y="46.9" width="54.9" height="149.1" rx="3"><title>3 to 5×: 58</title></rect>
|
|
<text class="nj-charts-val" x="370.9" y="41.9" text-anchor="middle">58</text>
|
|
<text class="nj-charts-tick" x="370.9" y="212.0">3 to 5×</text>
|
|
<rect class="nj-charts-c1" x="414.3" y="131.7" width="54.9" height="64.3" rx="3"><title>5 to 10×: 25</title></rect>
|
|
<text class="nj-charts-val" x="441.7" y="126.7" text-anchor="middle">25</text>
|
|
<text class="nj-charts-tick" x="441.7" y="212.0">5 to 10×</text>
|
|
<rect class="nj-charts-c1" x="485.1" y="185.7" width="54.9" height="10.3" rx="3"><title>10× or more: 4</title></rect>
|
|
<text class="nj-charts-val" x="512.6" y="180.7" text-anchor="middle">4</text>
|
|
<text class="nj-charts-tick" x="512.6" y="212.0">10× or more</text>
|
|
<line class="nj-charts-axis" x1="52" y1="196" x2="548" y2="196"/>
|
|
<text class="nj-charts-tick" x="300" y="240">speedup over 3.12.0, more is better</text>
|
|
<text class="nj-charts-tick" transform="rotate(-90)" x="-106" y="14">number of benchmarks</text>
|
|
</svg>
|