
88 lines
8.1 KiB
XML
88 lines
8.1 KiB
XML


<svg class="nj-fig nj-charts nj-charts--blog" viewBox="0 0 560 604" role="img" aria-labelledby="nj-blog-overview nj-blog-overview-d" xmlns="http://www.w3.org/2000/svg">
|
|
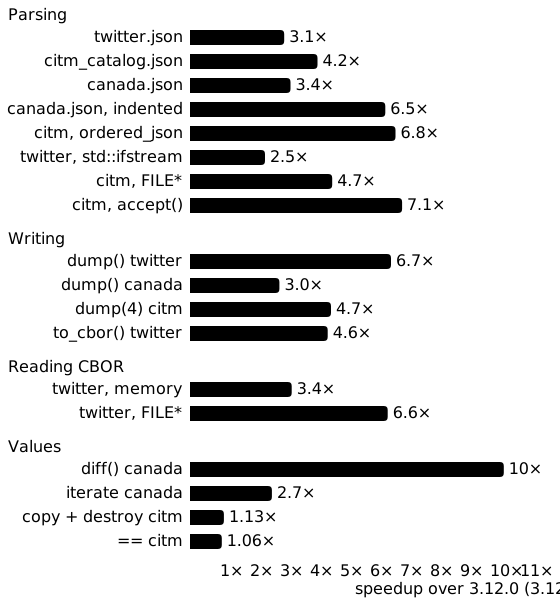
<title id="nj-blog-overview">Speedup of 3.13.0 over 3.12.0 per workload, Apple M1 Max, Apple clang</title>
|
|
<desc id="nj-blog-overview-d">Horizontal bars of the speedup, more is better. twitter.json 3.1x; citm_catalog.json 4.2x; canada.json 3.4x; canada.json, indented 6.5x; citm, ordered_json 6.8x; twitter, std::ifstream 2.5x; citm, FILE* 4.7x; citm, accept() 7.1x; dump() twitter 6.7x; dump() canada 3.0x; dump(4) citm 4.7x; to_cbor() twitter 4.6x; twitter, memory 3.4x; twitter, FILE* 6.6x; diff() canada 10x; iterate canada 2.7x; copy + destroy citm 1.13x; == citm 1.06x.</desc>
|
|
<text class="nj-charts-panel" x="8" y="20">Parsing</text>
|
|
<text class="nj-charts-panel" x="8" y="244">Writing</text>
|
|
<text class="nj-charts-panel" x="8" y="372">Reading C​BOR</text>
|
|
<text class="nj-charts-panel" x="8" y="452">Values</text>
|
|
<line class="nj-charts-grid" x1="220" y1="8" x2="220" y2="560"/>
|
|
<text class="nj-charts-tick" x="220" y="576">1×</text>
|
|
<line class="nj-charts-grid" x1="250" y1="8" x2="250" y2="560"/>
|
|
<text class="nj-charts-tick" x="250" y="576">2×</text>
|
|
<line class="nj-charts-grid" x1="280" y1="8" x2="280" y2="560"/>
|
|
<text class="nj-charts-tick" x="280" y="576">3×</text>
|
|
<line class="nj-charts-grid" x1="310" y1="8" x2="310" y2="560"/>
|
|
<text class="nj-charts-tick" x="310" y="576">4×</text>
|
|
<line class="nj-charts-grid" x1="340" y1="8" x2="340" y2="560"/>
|
|
<text class="nj-charts-tick" x="340" y="576">5×</text>
|
|
<line class="nj-charts-grid" x1="370" y1="8" x2="370" y2="560"/>
|
|
<text class="nj-charts-tick" x="370" y="576">6×</text>
|
|
<line class="nj-charts-grid" x1="400" y1="8" x2="400" y2="560"/>
|
|
<text class="nj-charts-tick" x="400" y="576">7×</text>
|
|
<line class="nj-charts-grid" x1="430" y1="8" x2="430" y2="560"/>
|
|
<text class="nj-charts-tick" x="430" y="576">8×</text>
|
|
<line class="nj-charts-grid" x1="460" y1="8" x2="460" y2="560"/>
|
|
<text class="nj-charts-tick" x="460" y="576">9×</text>
|
|
<line class="nj-charts-grid" x1="490" y1="8" x2="490" y2="560"/>
|
|
<text class="nj-charts-tick" x="490" y="576">10×</text>
|
|
<line class="nj-charts-grid" x1="520" y1="8" x2="520" y2="560"/>
|
|
<text class="nj-charts-tick" x="520" y="576">11×</text>
|
|
<text class="nj-charts-rowlabel nj-charts-tick--r" x="182" y="42" text-anchor="end">twitter.json</text>
|
|
<path class="nj-charts-c1" d="M190 30 H280.2 Q284.2 30 284.2 34 V41 Q284.2 45 280.2 45 H190 Z"><title>twitter.json: 3.1×</title></path>
|
|
<text class="nj-charts-val" x="289.2" y="42">3.1×</text>
|
|
<text class="nj-charts-rowlabel nj-charts-tick--r" x="182" y="66" text-anchor="end">citm_catalog.json</text>
|
|
<path class="nj-charts-c1" d="M190 54 H313.5 Q317.5 54 317.5 58 V65 Q317.5 69 313.5 69 H190 Z"><title>citm_catalog.json: 4.2×</title></path>
|
|
<text class="nj-charts-val" x="322.5" y="66">4.2×</text>
|
|
<text class="nj-charts-rowlabel nj-charts-tick--r" x="182" y="90" text-anchor="end">canada.json</text>
|
|
<path class="nj-charts-c1" d="M190 78 H286.5 Q290.5 78 290.5 82 V89 Q290.5 93 286.5 93 H190 Z"><title>canada.json: 3.4×</title></path>
|
|
<text class="nj-charts-val" x="295.5" y="90">3.4×</text>
|
|
<text class="nj-charts-rowlabel nj-charts-tick--r" x="182" y="114" text-anchor="end">canada.json, indented</text>
|
|
<path class="nj-charts-c1" d="M190 102 H381.3 Q385.3 102 385.3 106 V113 Q385.3 117 381.3 117 H190 Z"><title>canada.json, indented: 6.5×</title></path>
|
|
<text class="nj-charts-val" x="390.3" y="114">6.5×</text>
|
|
<text class="nj-charts-rowlabel nj-charts-tick--r" x="182" y="138" text-anchor="end">citm, ordered_json</text>
|
|
<path class="nj-charts-c1" d="M190 126 H391.5 Q395.5 126 395.5 130 V137 Q395.5 141 391.5 141 H190 Z"><title>citm, ordered_json: 6.8×</title></path>
|
|
<text class="nj-charts-val" x="400.5" y="138">6.8×</text>
|
|
<text class="nj-charts-rowlabel nj-charts-tick--r" x="182" y="162" text-anchor="end">twitter, std::ifstream</text>
|
|
<path class="nj-charts-c1" d="M190 150 H261 Q265 150 265 154 V161 Q265 165 261 165 H190 Z"><title>twitter, std::ifstream: 2.5×</title></path>
|
|
<text class="nj-charts-val" x="270" y="162">2.5×</text>
|
|
<text class="nj-charts-rowlabel nj-charts-tick--r" x="182" y="186" text-anchor="end">citm, FILE*</text>
|
|
<path class="nj-charts-c1" d="M190 174 H328.2 Q332.2 174 332.2 178 V185 Q332.2 189 328.2 189 H190 Z"><title>citm, FILE*: 4.7×</title></path>
|
|
<text class="nj-charts-val" x="337.2" y="186">4.7×</text>
|
|
<text class="nj-charts-rowlabel nj-charts-tick--r" x="182" y="210" text-anchor="end">citm, accept()</text>
|
|
<path class="nj-charts-c1" d="M190 198 H398.1 Q402.1 198 402.1 202 V209 Q402.1 213 398.1 213 H190 Z"><title>citm, accept(): 7.1×</title></path>
|
|
<text class="nj-charts-val" x="407.1" y="210">7.1×</text>
|
|
<text class="nj-charts-rowlabel nj-charts-tick--r" x="182" y="266" text-anchor="end">dump() twitter</text>
|
|
<path class="nj-charts-c1" d="M190 254 H387 Q391 254 391 258 V265 Q391 269 387 269 H190 Z"><title>dump() twitter: 6.7×</title></path>
|
|
<text class="nj-charts-val" x="396" y="266">6.7×</text>
|
|
<text class="nj-charts-rowlabel nj-charts-tick--r" x="182" y="290" text-anchor="end">dump() canada</text>
|
|
<path class="nj-charts-c1" d="M190 278 H275.4 Q279.4 278 279.4 282 V289 Q279.4 293 275.4 293 H190 Z"><title>dump() canada: 3.0×</title></path>
|
|
<text class="nj-charts-val" x="284.4" y="290">3.0×</text>
|
|
<text class="nj-charts-rowlabel nj-charts-tick--r" x="182" y="314" text-anchor="end">dump(4) citm</text>
|
|
<path class="nj-charts-c1" d="M190 302 H327 Q331 302 331 306 V313 Q331 317 327 317 H190 Z"><title>dump(4) citm: 4.7×</title></path>
|
|
<text class="nj-charts-val" x="336" y="314">4.7×</text>
|
|
<text class="nj-charts-rowlabel nj-charts-tick--r" x="182" y="338" text-anchor="end">to_cbor() twitter</text>
|
|
<path class="nj-charts-c1" d="M190 326 H323.7 Q327.7 326 327.7 330 V337 Q327.7 341 323.7 341 H190 Z"><title>to_cbor() twitter: 4.6×</title></path>
|
|
<text class="nj-charts-val" x="332.7" y="338">4.6×</text>
|
|
<text class="nj-charts-rowlabel nj-charts-tick--r" x="182" y="394" text-anchor="end">twitter, memory</text>
|
|
<path class="nj-charts-c1" d="M190 382 H287.7 Q291.7 382 291.7 386 V393 Q291.7 397 287.7 397 H190 Z"><title>twitter, memory: 3.4×</title></path>
|
|
<text class="nj-charts-val" x="296.7" y="394">3.4×</text>
|
|
<text class="nj-charts-rowlabel nj-charts-tick--r" x="182" y="418" text-anchor="end">twitter, FILE*</text>
|
|
<path class="nj-charts-c1" d="M190 406 H383.7 Q387.7 406 387.7 410 V417 Q387.7 421 383.7 421 H190 Z"><title>twitter, FILE*: 6.6×</title></path>
|
|
<text class="nj-charts-val" x="392.7" y="418">6.6×</text>
|
|
<text class="nj-charts-rowlabel nj-charts-tick--r" x="182" y="474" text-anchor="end">diff() canada</text>
|
|
<path class="nj-charts-c1" d="M190 462 H499.8 Q503.8 462 503.8 466 V473 Q503.8 477 499.8 477 H190 Z"><title>diff() canada: 10×</title></path>
|
|
<text class="nj-charts-val" x="508.8" y="474">10×</text>
|
|
<text class="nj-charts-rowlabel nj-charts-tick--r" x="182" y="498" text-anchor="end">iterate canada</text>
|
|
<path class="nj-charts-c1" d="M190 486 H267.9 Q271.9 486 271.9 490 V497 Q271.9 501 267.9 501 H190 Z"><title>iterate canada: 2.7×</title></path>
|
|
<text class="nj-charts-val" x="276.9" y="498">2.7×</text>
|
|
<text class="nj-charts-rowlabel nj-charts-tick--r" x="182" y="522" text-anchor="end">copy + destroy citm</text>
|
|
<path class="nj-charts-c1" d="M190 510 H219.9 Q223.9 510 223.9 514 V521 Q223.9 525 219.9 525 H190 Z"><title>copy + destroy citm: 1.13×</title></path>
|
|
<text class="nj-charts-val" x="228.9" y="522">1.13×</text>
|
|
<text class="nj-charts-rowlabel nj-charts-tick--r" x="182" y="546" text-anchor="end">== citm</text>
|
|
<path class="nj-charts-c1" d="M190 534 H217.8 Q221.8 534 221.8 538 V545 Q221.8 549 217.8 549 H190 Z"><title>== citm: 1.06×</title></path>
|
|
<text class="nj-charts-val" x="226.8" y="546">1.06×</text>
|
|
<line class="nj-charts-ref" x1="220" y1="8" x2="220" y2="560"/>
|
|
<line class="nj-charts-zero" x1="190" y1="8" x2="190" y2="560"/>
|
|
<text class="nj-charts-tick" x="355" y="594">speedup over 3.12.0 (3.12.0 = 1×), more is better</text>
|
|
</svg>
|